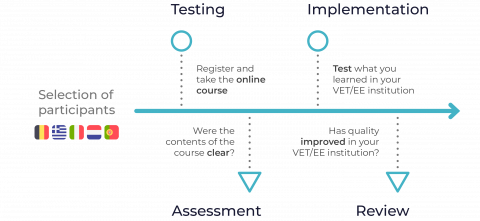
3.5 - Implementation
Abstract
As a Quality Manager of your VET organization, you need to monitor the activities and the
achievements of your team and/or your organization. But it’s quite difficult to do this, as you need
to constantly check deadlines, the results of a given activity and its quality. And, with the results of
your quality checks, you need to provide feedback to your team and/or your boss in order to
guarantee the quality standards of your VET organization.